Neal
Administrator
- Joined
- Jul 27, 2019
- Messages
- 14,334
- Location
- Midlothian, VA
- RV Year
- 2017
- RV Make
- Newmar
- RV Model
- Ventana 4037
- RV Length
- 40' 10"
- Chassis
- Freightliner XCR
- Engine
- Cummins 400 HP
- TOW/TOAD
- 2017 Chevy Colorado
- Fulltimer
- No
Interesting how the numbers are nothing like lead acid when correlating voltages to SOC's
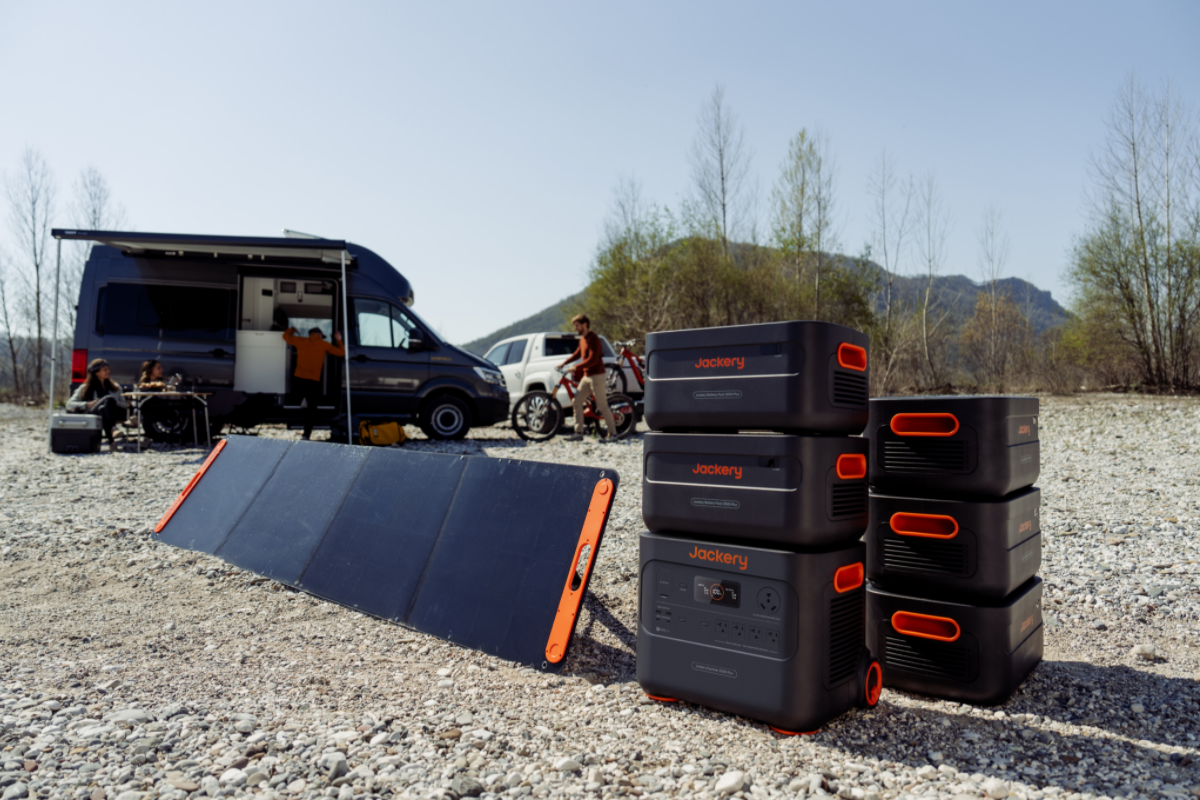
 www.jackery.com
| Percentage (SOC) | 1 Cell | 12V | 24V | 48V |
| 100% Charging | 3.65 | 14.6 | 29.2 | 58.4 |
| 100% Rest | 3.40 | 13.6 | 27.2 | 54.4 |
| 90% | 3.35 | 13.4 | 26.8 | 53.6 |
| 80% | 3.32 | 13.3 | 26.6 | 53.1 |
| 70% | 3.30 | 13.2 | 26.4 | 52.8 |
| 60% | 3.27 | 13.1 | 26.1 | 52.3 |
| 50% | 3.26 | 13.0 | 26.1 | 52.2 |
| 40% | 3.25 | 13.0 | 26.0 | 52.0 |
| 30% | 3.22 | 12.9 | 25.8 | 51.5 |
| 20% | 3.20 | 12.8 | 25.6 | 51.2 |
| 10% | 3.00 | 12.0 | 24.0 | 48.0 |
| 0% | 2.50 | 10.0 | 20.0 | 40.0 |
Ultimate Guide to LiFePO4 Voltage Chart - Jackery
The LiFePO4 voltage chart represents the state of charge based on the battery's voltage, such as 12V, 24V, and 48V — as well as 3.2V LiFePO4 cells. Read Jackery's guide to learn how to improve the capacity and lifespan of LiFePO4 batteries in detail.
www.jackery.com


